I write a great many tutorials targeting newer developers and as a direct result I am exposed to a fair number of programming related questions. I don’t mind in the least by the way, it’s why I run this site.
However, I notice one very common thread among those questions…
They often could have been solved with just a few minutes in the debugger.
Then it dawned on me. Lots of newer programmers likely don’t know all that much about debugging. Many are probably resorting to printing to the console to see how their program works. For good reason too… if you pick up say… a C++ book, it’s about the language, not the tooling. Of course, there are dedicated books such as Beginning Visual C++ 2013 or the Eclipse IDE: Pocket Guide, but these tend not to be books beginners start with. Hell, for someone just starting out, figuring out where the language begins and the IDE ends is challenging enough!
Which is all a shame, as basic debugging skills will make your life a hell of a lot easier. Not only will it make solving problems much easier, but it will help a great deal in understanding how your language works. Plus the most tragic part of all, it’s actually very simple and often incredibly consistent across tools and programming languages.
So, if you have no prior debugging experience, give me 20 minutes of your time. I guarantee you it will be worthwhile, or your money back!
I am going to use a couple different languages/IDEs int this tutorial, but as you will see, the process is remarkably similar regardless to what language you use. I am primarily going to start with Visual Studio, then illustrate how you can perform similar actions in other environments. First a quick glossary of terms you are going to hear.
Glossary of terms
These are a few of the terms we are going to be covering during this tutorial. Don’t worry over much if the following descriptions don’t make a lot of sense, it should be clearer by the time you finish.
Breakpoint
This one is critical, these are instructions that tell your code HEY, STOP RUNNING, I WANT TO LOOK AT SOMETHING HERE! We will be using breakpoints extensively. You can generally add/remove/enable/disable breakpoints.
Watch
This one is incredibly well named. Basically these are variables you’ve said you want to keep a watch on the value of.
Local
Think of these like Watch expressions the IDE automatically made for you. Basically every variable in local scope will be listed as a local. Not all IDEs do this, but most do.
Expression Evaluation
This is powerful. Basically you can type some code and see what result it returns, while your code is running. Generally you do this once a breakpoint has been hit causing your code to pause and your debugger to be shown.
Call Stack
This is the hierarchy of function calls you are currently in. For example, if you called myFunc() from main(), your callstack would look like
myFunc()
main().
Don’t worry, this should make sense shortly.
C++ and Visual Studio Debugger
I am going to start with Visual Studio/Visual C++ then show other platforms later on. Once again, most of the process you see here is applicable to other environments.
Let’s start with this ultra simple code example:
void someFunction(int & inValue) { inValue = 43; } int main(int argc, char ** argv) { int i = 42; someFunction(i); return 0; }
The code is extremely simple. We create a simple int, assign it a value, then pass it into a function that will assign it a different value. Now time to do some basic debugging.
The first thing you need to do is start debugging. In Visual Studio, there are a couple ways to do this. First thing, in C++, you need to tell it that you are building for debugging. You see, when you make a debug build a few different things happen. There are little bits of information added to your code that make the debugger work. There are some other changes too, like memory being zeroed out, but those are beyond what we are talking about here. The take away is, you need to build for debugging, then run the debugger, although generally this task is one and the same for you the developer.
From the Visual Studio toolbar, you can do both:
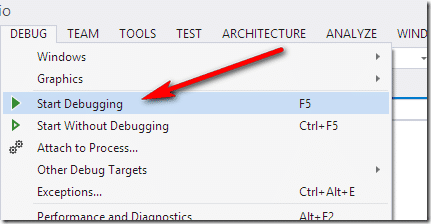
Or, you can run from the Debug menu:
As you can see, F5 is also an option. It’s worth noting, debug code generally runs a bit slower and bigger, so when you are finished development, you want to compile for release.
Ok, so that’s how we start the debugger, but in this code sample, it will simply start, run, then finish. That’s not very exciting.
Enter the breakpoint!
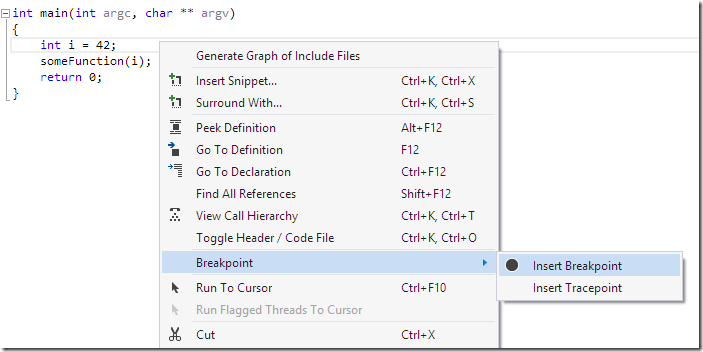
Ok, now we are going to enter the wonderful world of breakpoints, your new best friends. Let’s start by setting a breakpoint on our first line, where we declare i. There are a number of ways of setting a breakpoint. In the IDE you can right click the line of code you want to break on then select Breakpoint –> Insert Breakpoint, like so:
… for the sake of this tutorial, please just ignore Tracepoints, at least for now.
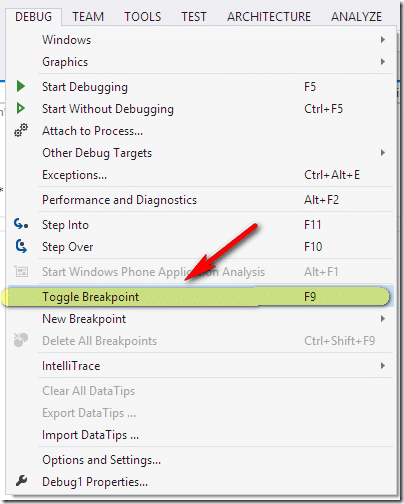
You can also set a breakpoint in the Debug menu, using Toggle Breakpoint, or by hitting F9:
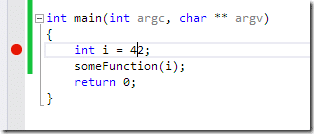
The line of code you just set a breakpoint on should now have a red bullet in the margin:
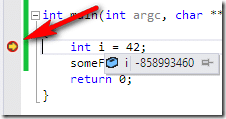
Go ahead and press F5 to debug your program. Things will go much differently this time, your code will stop executing on the line with the breakpoint. You can hover your mouse over a variable to see it’s value:
In this case, you will see that the value is gibberish. This is because i hasn’t been assigned yet. Notice the little yellow arrow on the left hand side? This is the line of code you are currently executing.
Stepping over the corpses of your vanquished foes
Now we need to navigate in the debugger. This is done using a couple simple commands:
Step Into, Step Over and Step Out. These are also available in the toolbar:
As you can see, you can also use the hotkey F11 and F10. These keys change from program to program… if they didn’t, that would just make life too easy, wouldn’t it?
Now as to what these do…
Step Into, steps into the currently running line of code. For example, if you are on a function, it will step into that function. I will show this in a second.
Step Over jumps to the next line of code in the same scope. Step out, jumps up on the callstack. Again, I will explain this in a second.
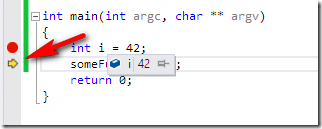
So what we want to do now is Step Over, and now it should look like this:
The little yellow arrow will now have advanced to the next line of code. Notice now if we hover over the value of i, it is now 42 like we would have expected. That is because the line of code has now executed. This is a very important thing to realize… the line of code your breakpoint stopped on hasn’t executed yet. So if you want to see what value is assigned to a variable, you generally want to set the breakpoint to the next line of code.
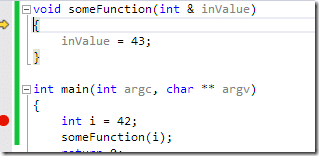
Now we want to “Step Into” the current line of code. That is, we want to see what happens when someFunction() executes. If we chose “Step Over”, we would jump to the next line ( return 0; ). There is another important thing to realize here… even if you Step Over some code, it is still being run like normal, it just isn’t showing you it in the debugger. That said, we want to see someFunction() in action, so choose Step Into or choose this icon:
Now the line of code jumps to the beginning of someFunction():
You can hover over parameters to see their value:
You can continue stepping in and over code like normal, or if you are done looking at someFunction ( or some other function someFunction calls ), you can choose Step Out to jump up on the callstack.
Callstack me, maybe? No, I didn’t just make that pun did I?
Callstack… there’s that word again. Now that we are actually in a bit of a call stack, let’s take a look at what I mean.
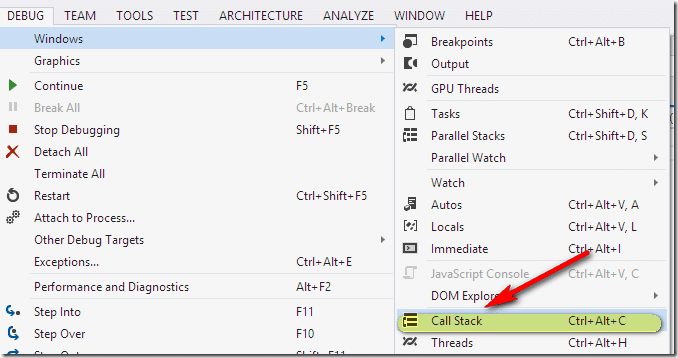
In Visual Studio, make sure the CallStack window is being shown. This is controlled using Debug->Window->CallStack or CTRL + ALT + C like so:
A window like the following should appear:
The key to the name is “STACK”. Think about it like a stack of plates at a cafeteria. Each time a function is called, it’s like putting a plate on the stack. The bottom most plate/function is the oldest, while the top most is the newest. In this case, the call stack tells us that on line 9, in the function main, we called someFunction() and are currently running on line 2. Speaking of “lines”, you have the option of toggling them on or off in Visual Studio ( and most other IDEs ).
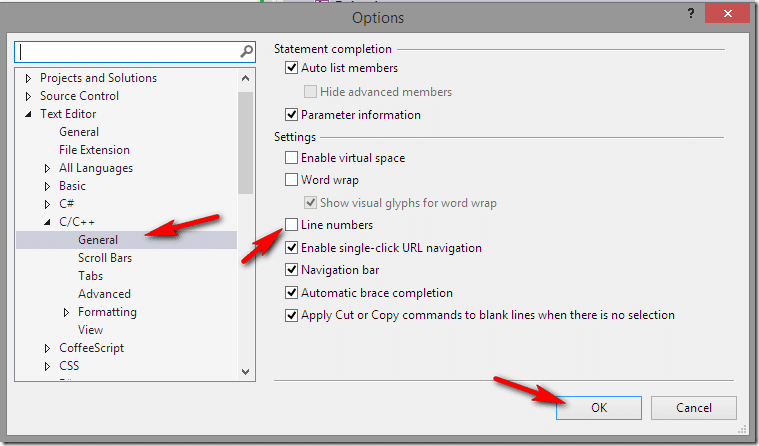
The process of toggling line numbers on/off, isn’t incredibly straight forward. That said, line numbers can be incredibly handy, so lets do it. First select the menu Tools->Options…
Then in the resulting dialog on the left hand side scroll down until you find Text Editor->C/C++->General, then click the checkbox next to Line Numbers. Obviously if you are using Visual Studio and a language other than C++, you need to pick the appropriate language:
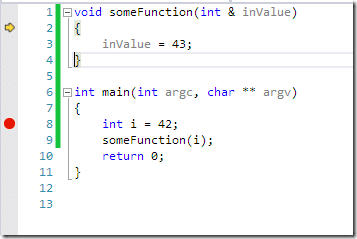
Now line numbers will be displayed next to your code:
Ok… back to the callstack. Double clicking an entry in the callstack brings you to that line of code. In this trivial example, the utility is questionable. However, when working with a real project, where the callstack might span multiple source files, it becomes a very quick and easy way to jump between source files and for seeing how you ended up where you are. This obviously is a hell of a lot more useful when someFunction() is possible called from thousands of different locations for example.
Locals, no more witty titles after that last witless one…
Now let’s take a look at locals, a concept I mentioned earlier. This is basically all the local ( non-global ) functions in the current scope. While debugging inside someFunction, like so:
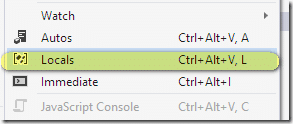
Open up the locals window. Like before it can be toggled using the menu Debug->Windows->Locals:
Now you will have a new window, like so:
This is a list of all variables in the local scope. Inside someFunction() there is only one value, it’s parameter inValue. Here you can see that the current value is 42 and it’s data type is int reference. As you step through someFunction, as values chance, they will be updated in the locals window.
Step out of someFunction ( Shift + F11, or using the icon or menus listed above ), and you will see the locals change to those of main():
Now you see something somewhat unique to C and C++ ( and other languages with direct memory management ). The value passed in, argv, is a pointer to a pointer of type char. This is to say, it points to a pointer that points to the memory address of a char data type. If that is greek to you at this point, don’t worry about it. You will notice though that the locals window has done a couple very cool things.
First, you see a hex value:
This is the actual address of the pointer in memory. After all, that is what pointers actually are, locations in memory. This is incredibly useful in debugging, even if you yourself don’t use pointers, code you depend on might. Look out for values like 0x0000000 or 0xFFFFFFFF. If you look at the value of a pointer and it’s one of those values, your object wasn’t allocated or has been deleted. These are some of the most common bugs you will find in C++ code.
The other neat thing that visual studio did was this:
The debugger was actually smart enough to go look at the data actually stored at the memory address this pointer points at. Very handy. You may also notice the triangle to the left of argv. This is because there is more information available. We will see this a bit more later.
Ok, now what?
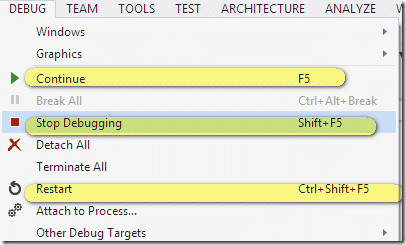
So… what do you do once you have found what you were looking for? You have a couple options. Here they are from the debug toolbar:
Or using the following commands from the Debug menu:
One thing to keep in mind, when your programming is running, the options and menu’s available in Visual Studio are different. For example, if you want to create a new project, you need to Stop Debugging before the menu options are even available.
Playing God with your Program
Ok, let’s rewind a bit and go back to the locals menu. This time we are going to use a slightly different code example.
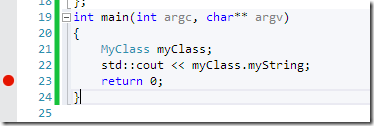
#include <iostream> #include <string> class MyClass{ public: int myInt; std::string myString; MyClass() : myInt(4), myString("Hello World"), myPrivateInt(5) { } private: int myPrivateInt; }; int main(int argc, char** argv) { MyClass myClass; std::cout << myClass.myString; return 0; }
Now let’s try setting a breakpoint on the final line of main, like so:
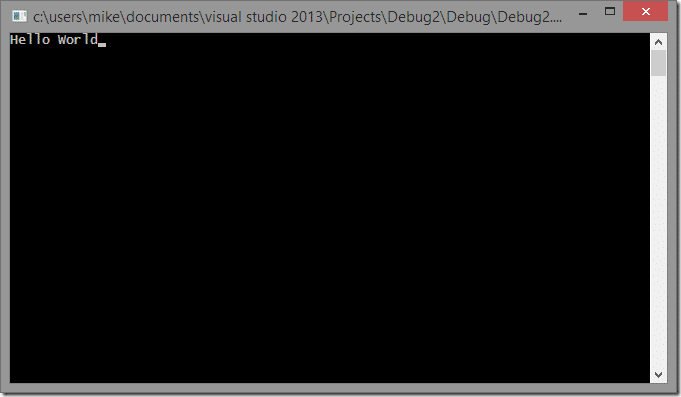
If you run this code, you will see:
You will have to ALT+TAB over to it, since debugger has given focus to Visual Studio.
Now lets look at some of the funky things you can do to a running program. Now let’s set another breakpoint, this one on the cout line. Remember, the code on the line you’ve breakpointed hasn’t been run yet!
Now restart or debug your program again. It will hit the first breakpoint right away. Now go look at the locals window again:
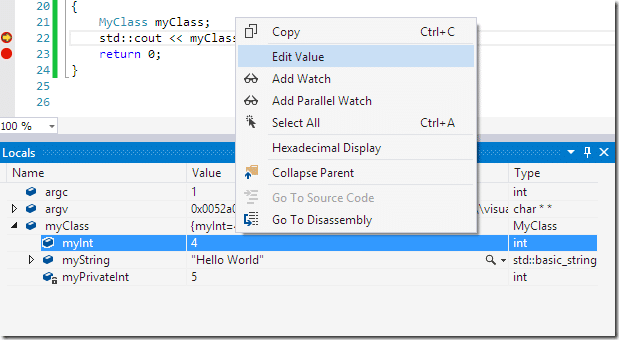
As you can see, data types composed of other data types, like myClass can be expanded to show all the other values that compose it. Now let’s do something kinda neat.
You can change the values of a program as it is running. Sorta… For basic data types, it’s extremely straight forward. For example, to change the value of myInt while debugging, simply right click it in the locals window and select Edit Value, like so:
You can now change the value:
From this point on ( during this debug session ), that value is now 42. Of course, if the value is changed in code, it will of course be updated. This allows you to tweak values interactively and see how it will affect your program’s execution.
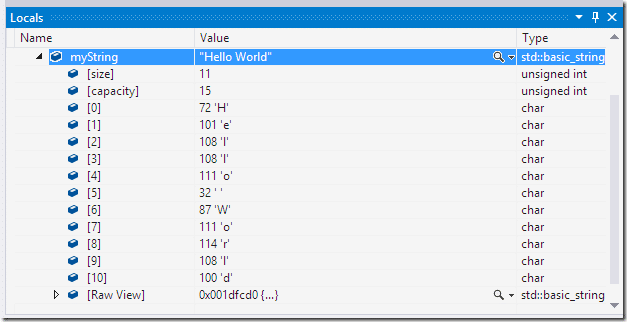
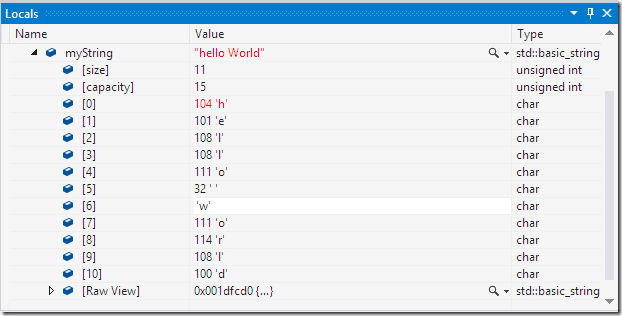
With objects however, it is slightly more complicated. In the previous case, we edited myInt which is a member of myClass. But we couldn’t simply edit MyClass directly, as the debugger has no idea how. Therefore you can’t just right click myString and select edit. The debugger simply doesn’t know how to edit this data type ( this isn’t true for non-C++ languages ). You can however modify the values that make up the string, like so:
As you can see, myString is of type std::basic_string, which is composed of an array of character values that make up the string. So we can edit the character values to say… lower case our string.
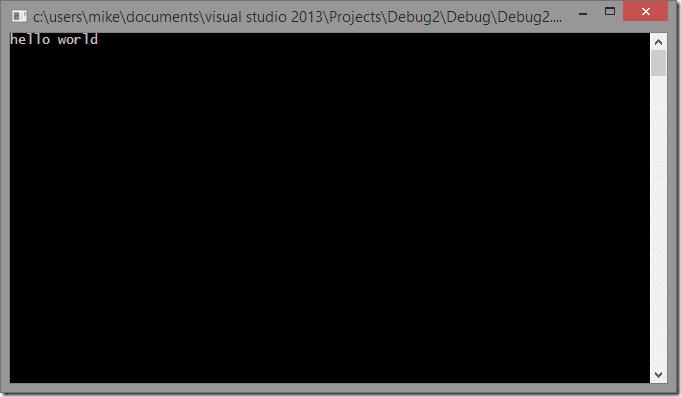
Once again, Visual Studio is smart enough to understand the datatype. So we could either enter the value ‘w’ or the ascii code 119. Now if you continue execution of your program it will automatically run to the next breakpoint. And if you look at the output, you should see:
One very important thing to note here… all of these changes are temporary. They only last as long as the current debugging session. The next time you run your program, it will run like normal.
I’m sick of these damned breakpoints
In that last example, when we selected Continue, we jumped to the next breakpoint, like so:
As you add more and more breakpoints to your code, they can make stepping through it incredibly annoying. So, what can we do about that?
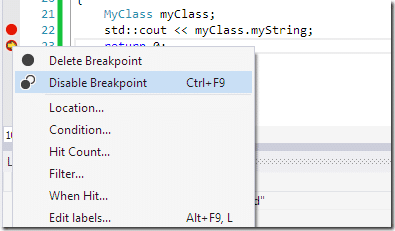
Well the first thing we can do is disable it. Right click the red dot and select Disable Breakpoint, or select the line and hit CTRL + F9
And the breakpoint will be disabled. Now it will show up as a hollow circle:
This allows you to re-enable it later, but until you do, the debugger will completely ignore the breakpoint. You can re-enable it the same way you disabled it. Right clicking and selecting enable, or by hitting CTRL + F9.
You can also remove a breakpoint complete in a couple ways. First you single left click the red dot, and it will be removed. The F9 key will also toggle a breakpoint on and off completely. You can also right click and select Delete Breakpoint ( see shot above ).
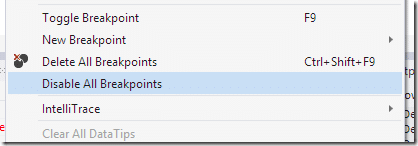
Sometimes you want to remove or disable/enable them all at once. You can do this using the debug menu:
Breakpoints are your friend, learn to love them!
I’m Watching You!
Now we are going to look at two final concepts, watches and expressions. Let’s start with watches.
Until this point, we’ve only been able to look at variables declared in the local scope. That’s all well and good, but what happens when we want to watch a value declared in a different scope? Don’t worry, the debugger’s got you covered!
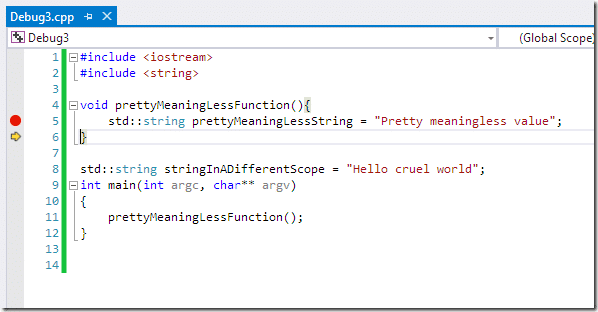
Consider this simple code example and breakpoint:
At this point in execution, your locals will look like:
That said, stringInADifferentScope has already been declared and allocated… how would you look at this value?
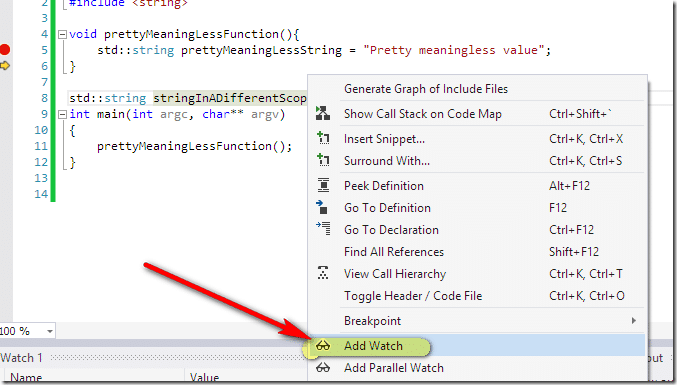
Well, there are two ways. As you may be able to guess from the preamble, they are watches and expressions. A watch is a variable you are keeping an eye on, even if its not currently local. You can set a watch while debugging code by right clicking the variable and selecting Add Watch:
Now you can look at watches in the watch window using the menu Debug->Windows->Watch->Watch 1 ( or CTRL+ALT+W then 1 ). You can have up to 4 sets of Watch windows in Visual Studio. Now you can inspect the value of watched variables at any time:
If you watch a variable that isn’t in scope, it tells you:
When the variable notInScope comes back in scope, it’s value can be retrieved by hitting the refresh icon.
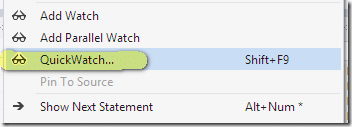
The other option is Evaluate Expression, which is called QuickWatch in Visual Studio. It’s an incredibly cool feature. You can invoke QuickWatch while debugging by right clicking and selecting QuickWatch… or by pressing Shift + F9.
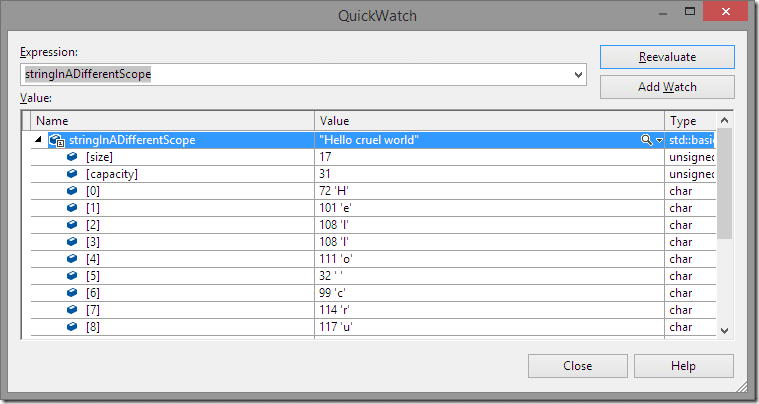
This opens a dialog that allows you to enter whatever value you want into the Expression tab, then press Re-Evaluate and it will look up the value:
The Add Watch button allows you to add the selected Expression to the watch window we just saw.
The cool thing about this you can actually call some functions on your object and get the results:
On One Condition
Back to breakpoints for a second, then I am done I promise.
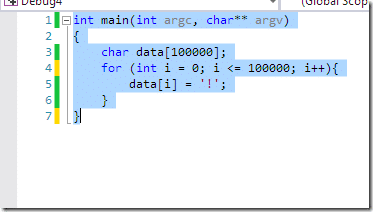
Consider the following code sample:
This is a very common bug scenario, but you really don’t want to run through the debugger 100K times do you? Generally with these kinds of errors, its only the last couple of iterations you want to look at. Fortunately we have something called a conditional breakpoint. This, as the name suggests, will only break if a certain condition is met.
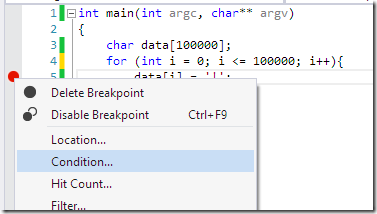
Add a breakpoint like normal. Add it to the line inside of the loop. Now right click the red dot and selection Condition…
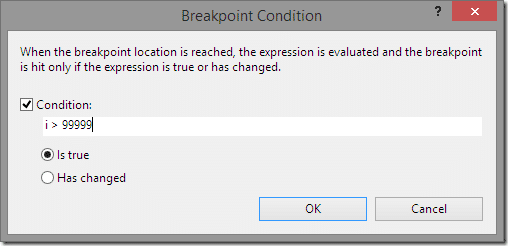
Now you can set the condition you will break on.
The breakpoint icon will now have a white plus in it:
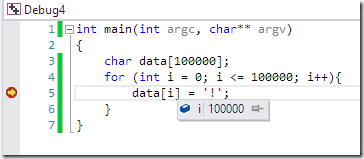
Next time you run the code, it will only trip when the condition is hit:
Unfortunately, in Visual Studio, conditional breakpoints can make your code ungodly slow, so only use them when absolutely required. In other languages and IDEs, this isn’t always the case. I honestly think this is a bug in Visual Studio, as the above code should not require several seconds to evaluate, even with the additional overhead.
One of the keys to happiness is a bad memory
One other thing that can be incredibly useful, especially in C++ is to look at a location in memory. This functionality isn’t always available, depending on the language you are using. In Visual C++, it’s incredibly easy and useful. In the previous example, we filled an array of char with 100K exclamation marks ( at least, once we remove the = sign from <= 🙂 ). Let’s say we wanted to look at memory for data.
In the Debug->Windows menu, select Memory->Memory 1
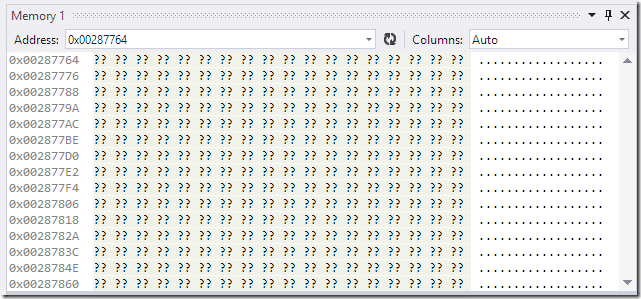
A window will open up like this:
That is showing what’s in memory, starting at the address 0x00287764. What you want is the address of the variable data. In the address box enter the value &data. (For non-C++ programmers reading this, & is the address of operator, which returns the memory location of a variable ).
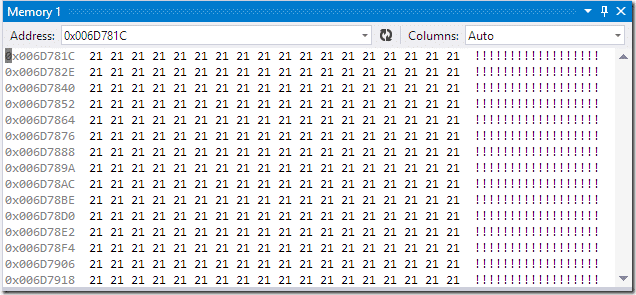
Now you will see:
As you can see, data is located at 0x006D781C and is full of exclamation marks ( shown on the right ), which is represented by ascii character code 21 ( as shown on the left ). Looking at memory can often help you find nasty bugs.
Debugging in other languages/IDEs
The instructions above were obviously C++ and Visual Studio related, but you will find other than the windows looking a bit different, some slightly different names and different hot keys, the process is almost identical. Instead of going through the same process for every language, I will instead point out where all of these things are located or what they are called.
Java in Eclipse
Starting/Stopping:
Just like in Visual Studio, there is both a debug and run mode. In order to debug in Eclipse you need to run using debug. There is a menu option available:
You can also right click your project in the Package Explorer and select Debug As->Java Application.
Or using the Debug icon in the toolbar:
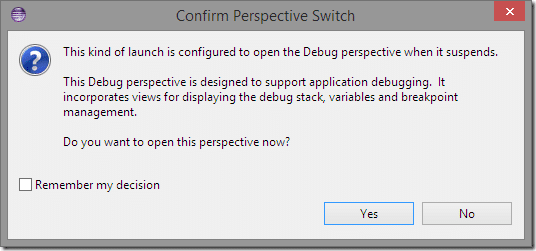
When you debug in Eclipse, you will be prompted to open in Debug perspective:
A perspective is simply a collection of windows and toolbars to accomplish a given task… such as debugging. You can switch between perspectives using the top bar:
Or using the menu Window->Open Perspective.
Setting a Breakpoint:
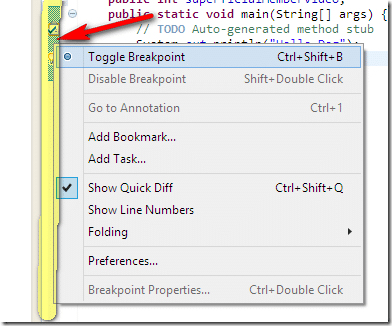
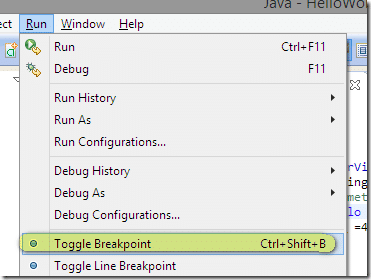
You can set a breakpoint in a number of ways in Eclipse. In a source window, you can right click the side column and select Toggle Breakpoint ( or CTRL+SHIFT+B ). This adds a breakpoint, or removes on if there is one currently added.
You can also toggle a breakpoint using the Run menu:
Step Into/Step Over/Step Out:
While running in Debug perspective, you can perform stepping using the toolbar:
You can also resume and stop your program using this toolbar. The icons are Step In, Stop Over and Step Out, from left to right.
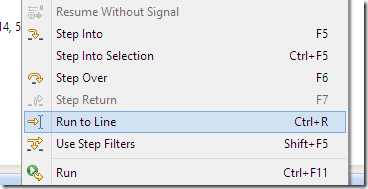
You can also step using the Run Menu:
You can also use F5/F6/F7 to control stepping.
Watch Window
In Eclipse, Locals and Watch are in the same view, “Variables”.
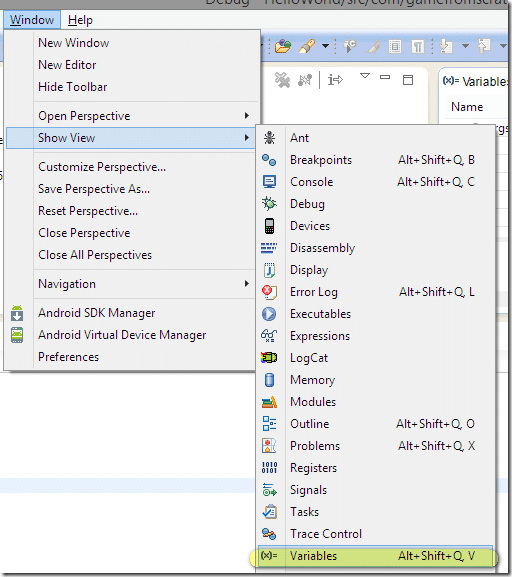
Variables should be available automatically when you launch into Debug perspective. However you can also open It using the menu Window->Show View->Variables. Or Alt+Shift+Q, then V.
Local Window:
See above.
Evaluate Expression:
Evaluate expression is called “Expressions” in Eclipse and is available using the same menu you used to open Variables.
Once again, you can dynamically execute code and see the results using Expressions.
Conditional Breakpoints
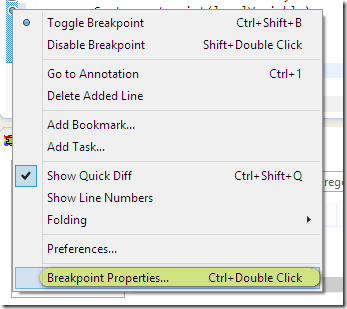
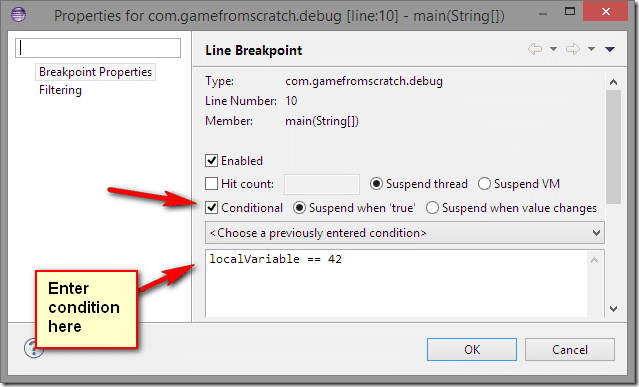
To set a conditional breakpoint in Eclipse, add a breakpoint like normal. Then right click the dot and select Breakpoint Properties:
Then in the resulting dialog, check condition and enter your condition logic in the box below:
JavaScript in Chrome
Starting/Stopping:
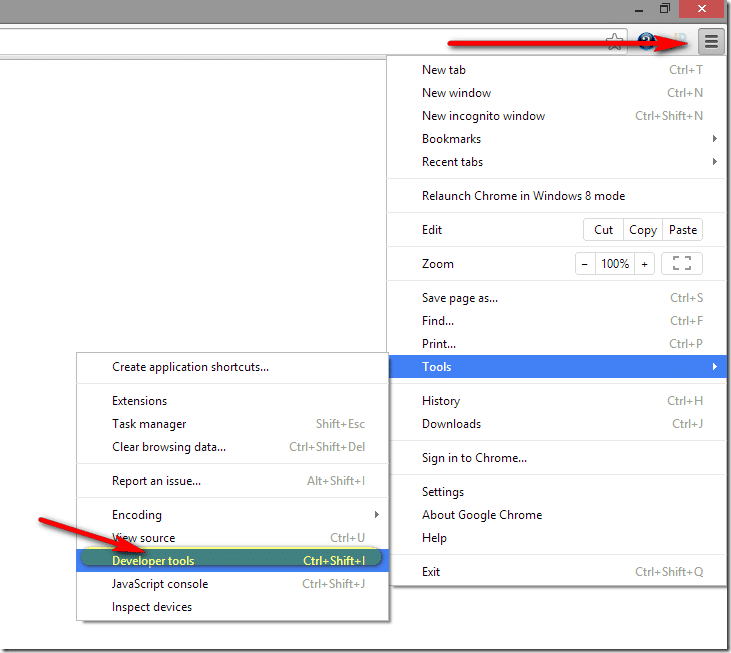
In Chrome ( and other browsers, IE, Opera, Safari and Firefox are all very similar in functionality ), there is no such thing as debug or release, unless I suppose you count minified code. Simply set a breakpoint in your JavaScript and refresh the page. You will however have to open Developer Tools to be able to set a breakpoint. Do this by clicking the Chrome menu button, selecting Tools->Developer Tools
Or as you can see above, press F12 or Ctrl + Shift + I. Memorize that key combo, trust me…
Setting a Breakpoint:
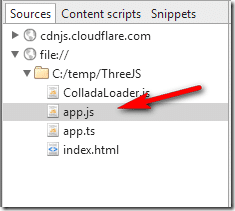
To set a breakpoint, in the go to a source file:
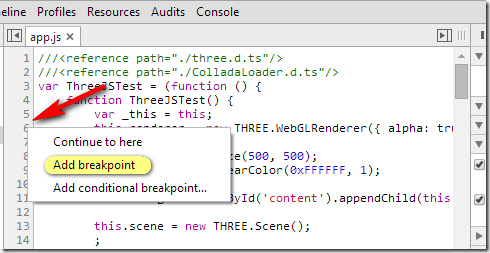
Then in the source listing, right click on the left column and select Add Breakpoint:
… bet you can guess how to set a Conditional Breakpoint… 😉
You can also toggle a breakpoint using CTRL + B.
Step Into/Step Over/Step Out:
Step Over: F10
Step Into: F11
Step Out: Shift + F11
Or you can use the toolbar:
Watch Window
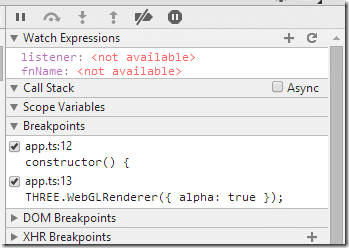
Window is located on the right hand side of the developer tools and is called Watch Expressions:
Expressions and Watches are combined into the same interface. You can simply add a new one by clicking the + icon, then type code accordingly:
Local Window:
Called Scope Variables in Chrome. Located in same area:
Evaluate Expression:
See watch above.
Conditional Breakpoints:
Just like adding a regular breakpoint, but instead choose Conditional Breakpoint.
Then type your conditional logic code:
WebStorm / JavaScript
Ok.. I’m just being lazy here. I remember I already wrote an article about debugging in WebStorm… recycling is good, no? 😉
Debugging your app in WebStorm
It actually covers 100% of what we just talked about above, except of course the memory view, as it isn’t applicable.
Ok, Done talking now
As you can see, across tools the experience is very similar. Some IDEs are worse ( Xcode… ), some are very limited ( Haxe in FlashDevelop ), but generally the process is almost always exactly the same. Of course, I only looked at a couple IDEs but you will find the experience very consistent in several different IDEs. It’s mostly a matter of learning a few new hotkeys and window locations.
One area that is massively different in command line debuggers, such as gdb. You are still doing basically the same things, just no nice UI layer over top. A discussion of gdb debugging is way beyond the scope of this document and there’s tons of information out there. Heck, there are books written on the subject!
Hopefully that process was useful to you. A while back I posted an example where the debugger saved my ass if you want to see this actual process in action. Debugging should be a part of your development process, it will make your life a hell of a lot easier, and your hair a hell of a lot less white.
Let me know if that wasn’t very clear, this tutorial may actually require a step by step video companion to go along with it. If so, please let me know.


