In the past I mentioned and even recommended HTML5 developers give WebStorm a shot, this is the IDE I use personally when working in JavaScript, but I realized I never actually said why. One of the big reasons is, its just a good solid text editor, with good project management and solid code completion, which is an area most tools fail at. But one of the biggest reasons is, it gives a rock solid debugging experience… very similar to native code. This is something that can make JavaScript development a WHOLE lot nicer.
EDIT: I should make it clear at this point, virtually nothing in this guide is specific to WebStorm, you can debug using the Chrome Developer Tools or using Firebug in FireFox. Webstorm however integrates the process directly within the IDE. The process will change slightly ( different buttons/hotkeys ), but the instructions below basically apply to debugging in browser as well.
At the same time it dawned on me… if you don’t come from a compiled code background, you probably don’t even realize what you have been missing! So, I have put this post together, it will hopefully make the developer experience better for at least a couple of you. If you are currently debugging using a combination of alerts, console writes and breakpoints in the browser, listen up!
First off, you are going to need a project to debug. I am going to use my most recent tutorial post on creating sprite sheets with Cocos2D if you want to download and follow along. Of course, any project will work, but that particular project has an interesting… quirk that will come in useful. Next, to get the most out of Webstorm debugging, you should also have Firefox installed. If you are doing web development, I assume you do already anyways. Alright, let’s get started.
Open the project up in WebStorm.
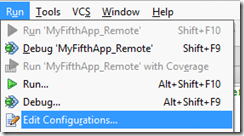
Now we want to create a debug profile. In Webstorm, select Run->Edit Configurations…
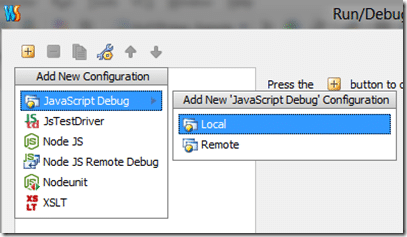
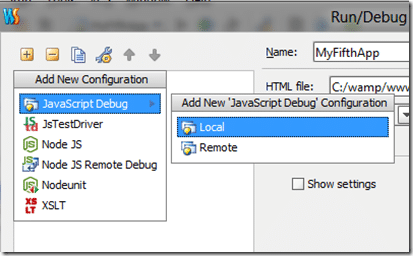
In the resulting dialog, click the + icon:
Choose JavaScript Debug –> Local
On the left hand side, a new entry should appear. Select it and file in the form like follows. Navigate to your index.html or root HTML file, select Firefox from the browser dropdown and name it whatever you would like:
Click Apply then Ok when complete.
You are now ready to debug.
Select Run-> Debug ‘Your App’ or press Shift + F9
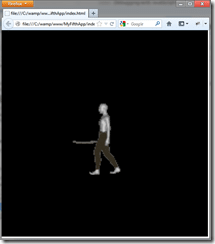
Voila, or app should load up in our browser:
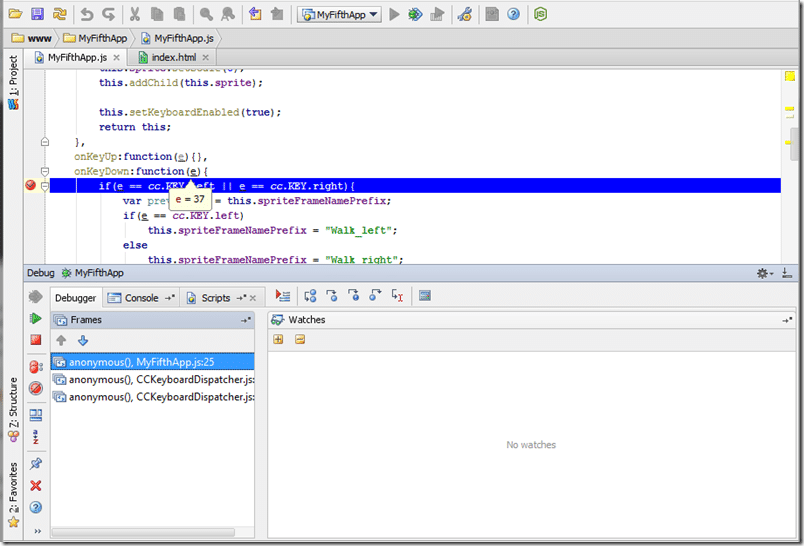
Now what we want to debug is debug the activity that occurs when the user presses a key. Go back over to Webstorm, open MyFifthApp.js , locate the line with onKeyDown: function, and select the line right below it. Here we want to set a breakpoint, which will cause our code to stop when the breakpoint is hit. Set a breakpoint by hitting CTRL+F8 or selecting Run->Toggle Line Breakpoint. You will see a red dot once your breakpoint is set, like so:
With the breakpoint set, now flip back to Firefox and hit a key. This will immediately trigger the breakpoint, pausing your programs execution. Now if you head back to Webstorm, there will be a wealth of information available to you:
There is quite a bit going on here. Our code is currently paused executing on our breakpoint. You can’t see it in the screenshot, but I am hovering my mouse over the e parameter, and it is popping up a tooltip showing its current value. When debugging, you can interact with your code in a lot more detail. Now lets take a closer look at the different bits of the interface here.
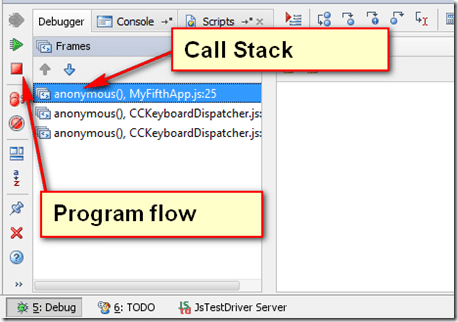
At the bottom left you have a very important window:
The toolbar on the left hand side can be used to resume program execution, stop completely, or to run from the beginning ( currently grayed out ). When you are done with a breakpoint, you hit the resume button to continue your program execution. The two buttons below on the toolbar are for managing breakpoints ( you can end up with a lot of them quickly! ), as well as to mute a breakpoint, which causes it not to fire DURING THIS DEBUGGING SESSION. The next time you run your program, your breakpoint will be re-enabled unless you remove it.
To the right is something traditionally called a callstack, and it’s extremely useful. Basically, it’s a hierarchy of the last functions called. So in this case, you can see that our current ( anonymous) method inside MyFifthApp, was called by an anonymous method in CCKeyboardDispatcher, which was called by a different method in the same file. Clicking the value in the callstack will immediately bring you to the line of code, where you can inspect the current value of any variables there. Often the error actually occurs further up the callstack, so being able to trace backwards through a programs execution is incredible handy.
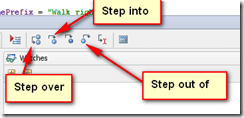
Next is an incredibly valuable toolbar, that controls your program’s execution while debugging.
These three are the most commonly used.
Step Over will cause your code to jump to the next line of code in the same file.
Step Into will jump into the code that you are currently on. If it is a function for example, it will jump into the code for that function, even if it is in a different file.
Step Out backs you out, think of it like undoing a step into, you basically jump back into the calling code.
You use these 3 buttons ( or their hotkey/menu equivalents ) to run through your code as you debug. There is also an option of run to cursor, which will run to whatever line of code your cursor is currently active on ( clicked on, not just hovering over ).
The program will update as it executes, so keep in mind, variable values will often be garbage, until the line they are allocated on is executed.
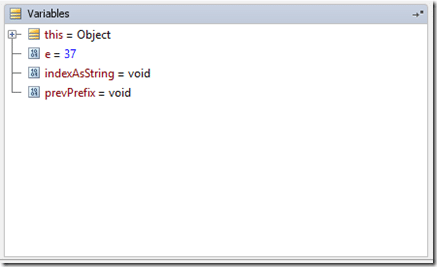
Next up is the Variables window. Often called “Locals” in other IDEs:
This is a list of all locally declared variables. Notice how indexAsString and prevPrefix are both shown, but valued as void? This is because they haven’t been executed yet. Lets take a closer look at that. In WebStorm, locate the line this.removeChild(this.sprite), left click it to focus your cursor, then select run to cursor from the toolbar we just discussed:
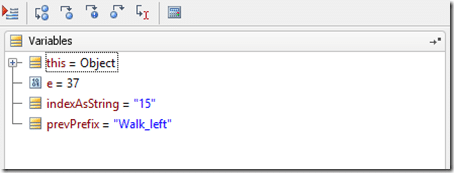
As you can see from the blue line, or program execution continued to that point. More importantly, if you look in the Variables window, they will now have values, since they have executed in the debugger:
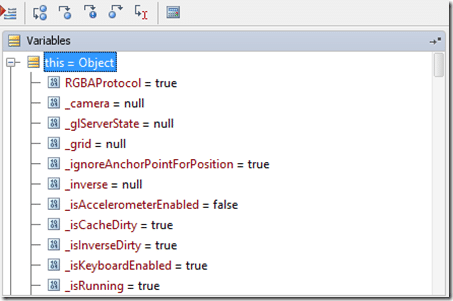
You may also notice the + sign next to this. That is because it isn’t a single value variable, so it is composed of other values. Clicking the + icon will give you more details about the contents of that object:
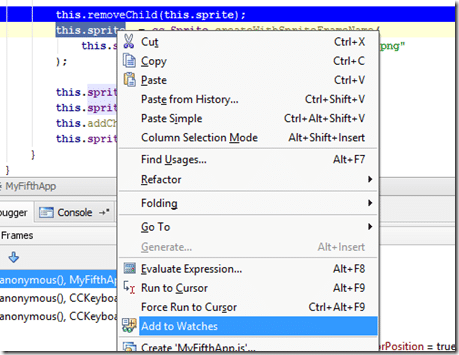
Of course, often you want particular information about a specific variable. This is where watches come in. Say we want to see more details about this.sprite. In your code window, select all of this.sprite, right click and select Add To Watches.
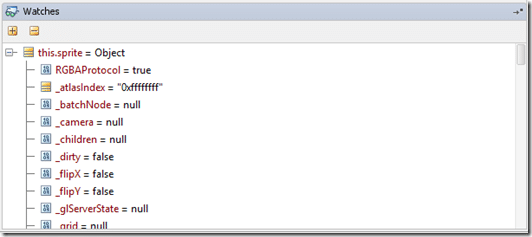
Now details of that variable will be available in the watches window, at least, when it is in scope it will:
You can watch a number of variables at the same time. Watches are especially useful for watching long lasting variables, like Director or when working in a browser, document. Just like in the variables list, you can drill down to get more information on child values of the watched variable.
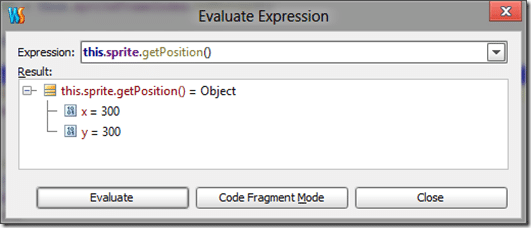
Another incredibly handy ability is the expression evaluator, invoked with this button:
The expression evaluator allows you to run any arbitrary code and see the value. You can used it for example, to see what a function value would return. Here for example, I am examining the results of calling this.sprite.getPosition(). Nicely, the expression evaluator has full code hints.
Finally, sometimes you want to debug code that is running from a server. This is especially true if you are doing a number of AJAX or socket requests. You can do this with Webstorm as well, with a few requirements. First, you need to have a copy of the code installed locally, next you need to use Firefox for this part.
Let’s try it with our sample project, which exists on my servers at https://www.gamefromscratch.com/downloads/cocos2d/run/MyFifthApp/index.html while you can download the project source code at https://www.gamefromscratch.com/downloads/Cocos2d/zips/MyFifthApp.zip.
First we need to create a new remote debugging session. In WebStorm, select Run->Edit Configurations… Hit the + icon and selection JavaScript Debug->Remote.
Fill the resulting dialog out like so:
Click Apply then OK. Now everything else works exactly like it did before, with one exception. Select Debug MyFifthApp Remote.
When you run your code and it hits a breakpoint, it will need you to tell it what file on the remote server matches the file the breakpoint is in. Since we have a breakpoint set in MyFifthApp.js, when we run it, we will see:
Simply click the Set link, and a dialog will appear:
Simply type the URL of the remote file. You only need to perform this once per file you set a breakpoint into. You of course can perform this setup step in advance if you want.
Now you can locally debug code that is actually running on a remote server.
I hope you’ve found this guide handy. In IDE debugging can make life a thousand times easier.
General Programming

